Q3 statistics 2021
In "Danish gambling market statistics since 2012" you may find statistics for Q2 2021 for the Danish gambling market. Moreover, all statistics from Q1 2012 and foreward are available.
Due to a transition of the Danish Gambling Authority´s gambling transaction system, some pages are not updated with Q4 2020 and Q3 2021 figures. The figures will be updated, when the relevant data is available.
Here, you will find the statistics for the Danish gambling market from Q1 2012 to Q4 2022 as well as statistics for the helpline StopSpillet and ROFUS (register of self-excluded players).
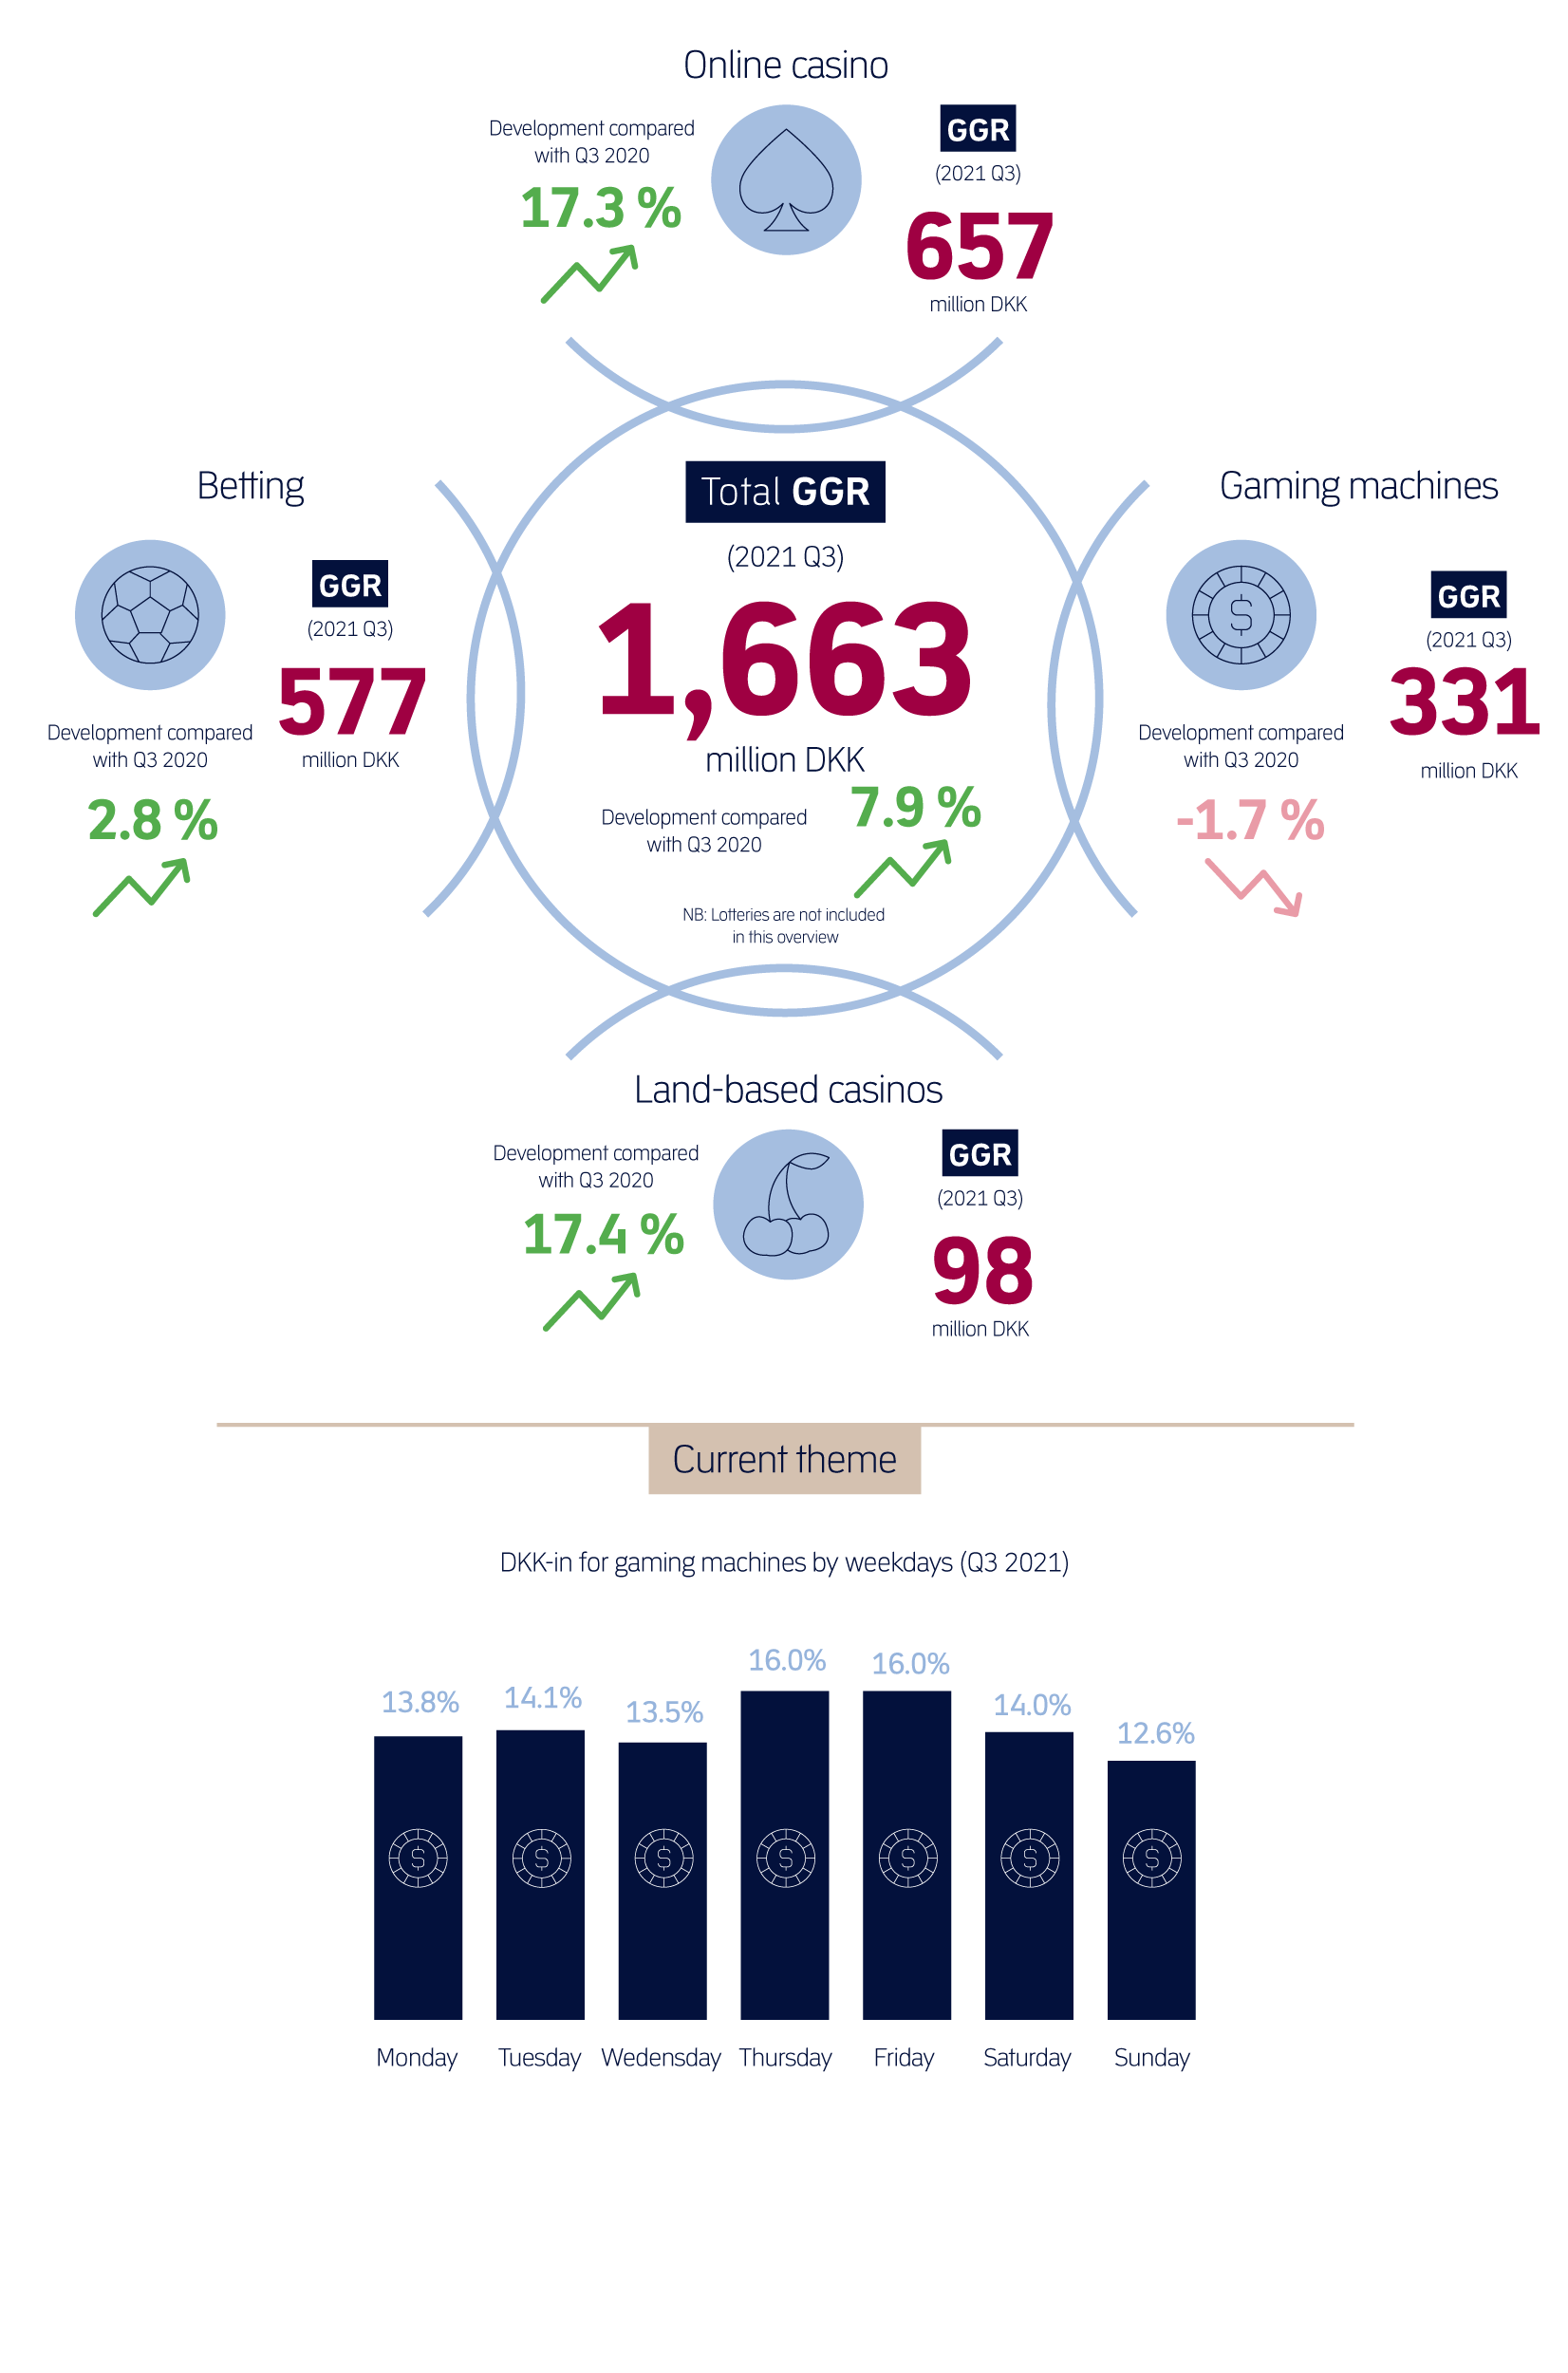
Figures from the Danish Gambling Authority’s quarterly statistics show that the total gross gaming revenue (GGR) for betting, online casino, gaming machines and land-based casino in Q3 2021 amounted to DKK 1,663 million. This is a year-on-year increase of DKK 122 million, which equals 7.9 percent. Only the gaming machine sector did not see an increase in Q3.
A guide explaining the most common terms we use to describe the Danish gambling market.
Headline figures from Q3 2021
The most recent statistics from the Danish Gambling Authority
Find the Danish Gambling Authority's most recently published quarterly statistics.