Q4 2020 statistics
The Danish Gambling Authority's Q4 2020 statistics for the Danish gambling market are now available. All quarterly statistics from Q1 2012 onwards are available in Power BI.
Due to a transition of the Danish Gambling Authority´s gambling transaction system pages “Stakes and behavior: Betting” and “Stakes and behavior: Online casino” are not updated with data for Q4. Furthermore, figures for ROFUS are updated up to and including October 2020.
Figures for lotteries in 2020 are expected to be published when the Q1 2021 statistics are released.
Here, you will find the statistics for the Danish gambling market from Q1 2012 to Q4 2022 as well as statistics for the helpline StopSpillet and ROFUS (register of self-excluded players).
Headline figures from Q3 2020
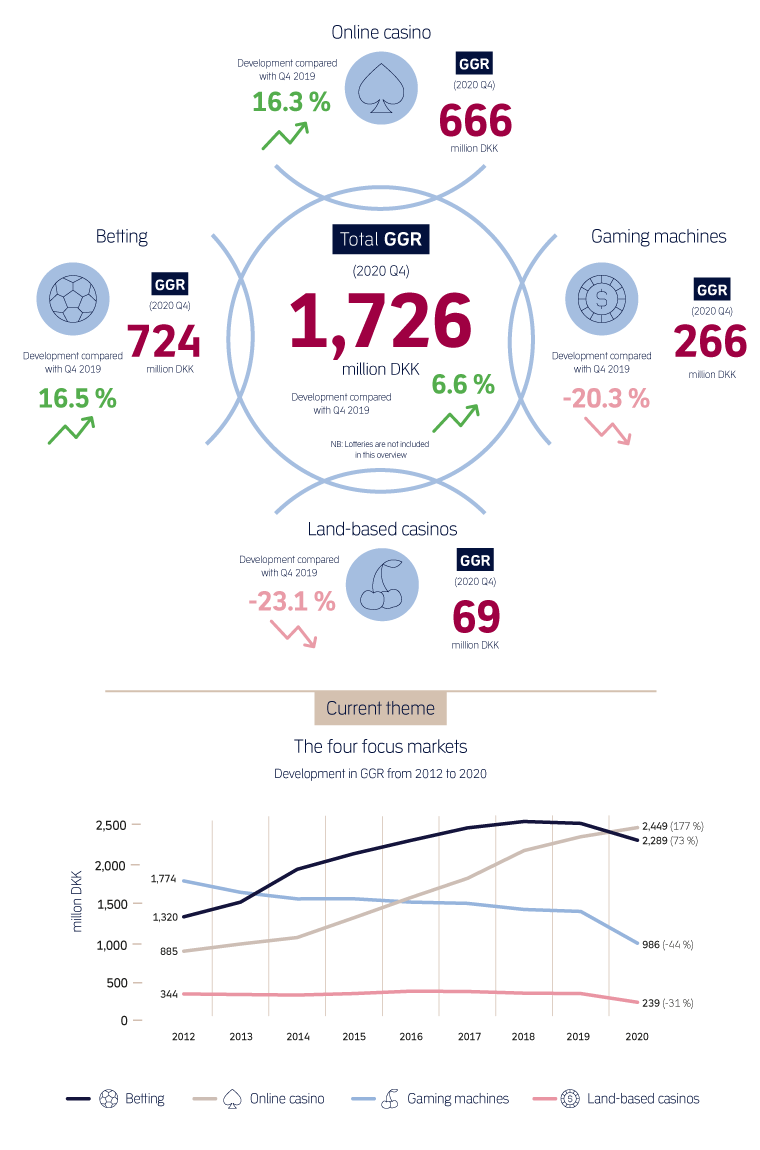
The most recent statistics from the Danish Gambling Authority
Find the Danish Gambling Authority's most recently published quarterly statistics.